js代码:
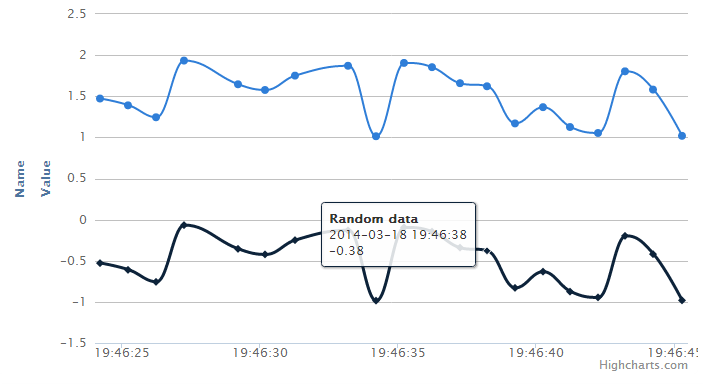
$(function() {$(document).ready(function() {Highcharts.setOptions({global: {useUTC: false}});var chart;chart = new Highcharts.Chart({chart: {renderTo: "container",type: "spline",animation: Highcharts.svg,// don"t animate in old IEmarginRight: 10,events: {load: function() {}}},title: {text: "Live random data"},xAxis: {type: "datetime",tickPixelInterval: 150},yAxis: [{title: {text: "Value"},plotLines: [{value: 0,width: 1,color: "#808080"}]},{title: {text: "Name"},plotLines: [{value: 0,width: 1,color: "#808080"}]}],tooltip: {formatter: function() {return "<b>" + this.series.name + "</b><br/>" + Highcharts.dateFormat("%Y-%m-%d %H:%M:%S", this.x) + "<br/>" + Highcharts.numberFormat(this.y, 2);}},legend: {enabled: false},exporting: {enabled: false},series: [{name: "Random data",data: (function() { // generate an array of random data var data = [],time = (new Date()).getTime(),i;for (i = -19; i <= 0; i++) {data.push({x: time + i * 1000,y: Math.random()});}return data;})()},{name: "Random data",data: (function() { // generate an array of random data var data = [],time = (new Date()).getTime(),i;for (i = -19; i <= 0; i++) {data.push({x: time + i * 1000,y: Math.random()});}return data;})()}]}); // set up the updating of the chart each second var series = chart.series[0];var series1 = chart.series[1];setInterval(function() {var x = (new Date()).getTime(),// current time y = Math.random();series.addPoint([x, y + 1], true, true);series1.addPoint([x, y - 1], true, true);},1000);});});html代码:<head> <script type="text/javascript" src="js/jquery.min.js"></script> <script type="text/javascript" src="js/highcharts.js"></script> <script type="text/javascript" src="js/exporting.js"></script> <script>//左侧Javascript代码 </script></head><body> <div id="container" style="min-width:700px;height:400px"></div></body>以上这篇Highcharts 多个Y轴动态刷新数据的实现代码 就是小编分享给大家的全部内容了,希望能给大家一个参考,也希望大家多多支持脚本之家。