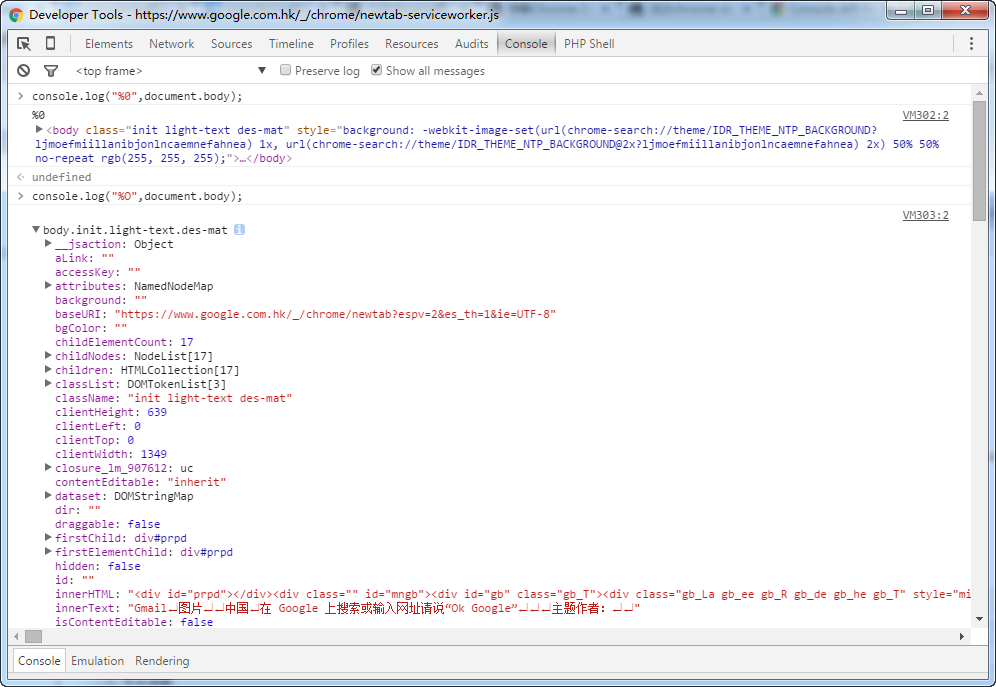
if(!window.console){ window.console = {log: function(){} }; }var someObject = { str: "Some text", id: 5 };console.log(someObject);//Object {str: "Some text", id: 5}console.log("%o",document.body);console.log("%O",document.body);
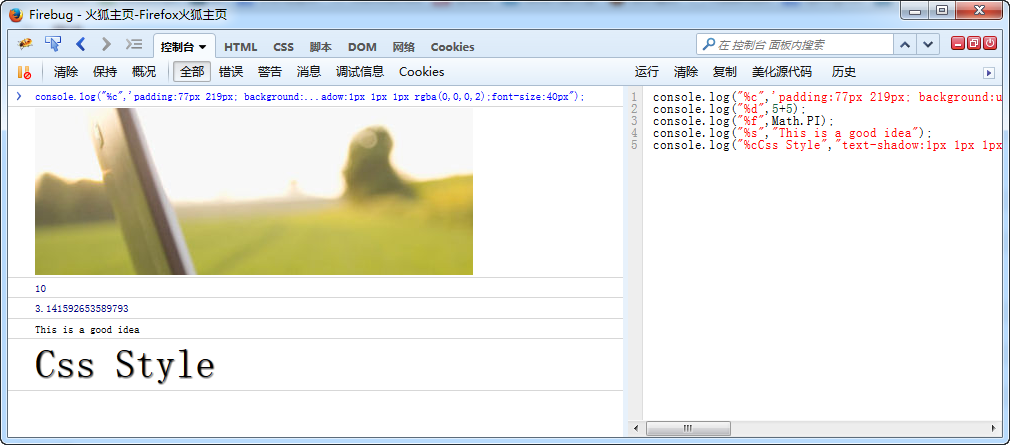
console.log("%c","padding:77px 219px; background:url(http://www.erongtu.com/application/uploads/ask/2015-10-20/5625a690f0ddd.jpg) no-repeat;line-height:166px;height:166px;");console.log("%d",5+5);console.log("%f",Math.PI);console.log("%s","This is a good idea");console.log("%cCss Style","text-shadow:1px 1px 1px rgba(0,0,0,2);font-size:40px");
Firefox 41.0.2 下测试
不过网上有一个有趣的东西 console.image,chrome自带的有扩展 https://github.com/jffry/console.image-chrome-extension
console.image("http://i.imgur.com/hv6pwkb.png");
console.image("http://i.imgur.com/hv6pwkb.png");
console.image("http://i.imgur.com/hv6pwkb.png");
console.image("http://i.imgur.com/hv6pwkb.png");
源代码地址:https://github.com/adriancooney/console.image
2、console.info/console.log
var car = "Dodge Charger";
var someObject = {str:"Some text", id:5};
console.info("My first car was a", car, ". The object is: ", someObject);
for (var i=0; i<5; i++) {
console.log("Hello, %s. You"ve called me %d times.", "Bob", i+1);
}
console.log("I want to print a number:%d","string")

3、console.group/console.warn/console.time/console.debug
console.log("This is the outer level");
console.group();
console.log("Level 2");
console.group();
console.log("Level 3");
console.warn("More of level 3");
console.groupEnd();
console.log("Back to level 2");
console.groupEnd();
console.debug("Back to the outer level");
console.time("answer time");
alert("Click to continue");
console.timeEnd("answer time");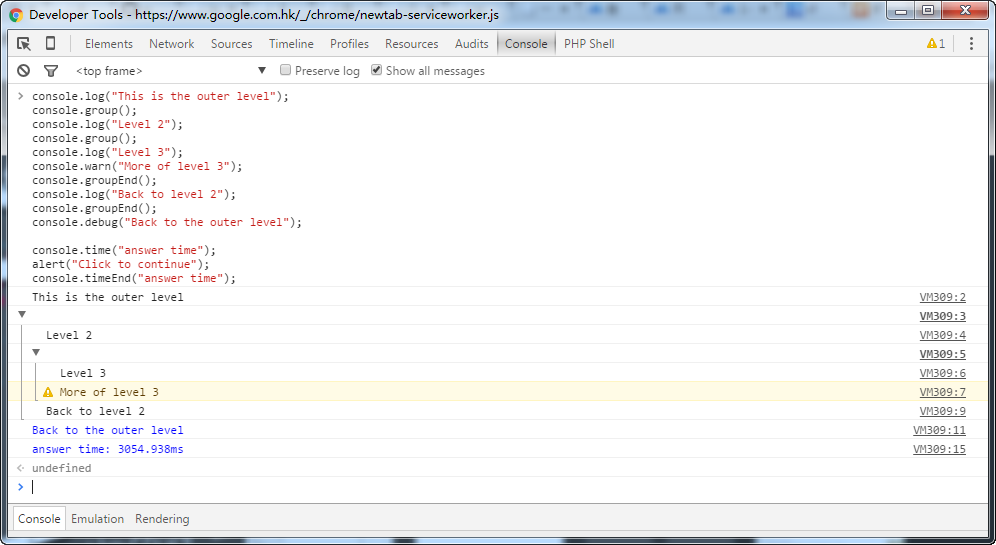
4、console.trace 在页面console文档中查看堆栈跟踪的详细介绍和示例.这个比较好用
foo();function foo() { function bar() {console.trace(); } bar();}
5、console.assert/console.count/console.dirxml/console.dir/console.error
var list = document.querySelectorAll("div.rtmarg");console.assert(list[0].childNodes.length > 10 , "Oops,this is small");function login(user) {console.count("Login called for user "" + user + """);}login("join");login("join");login("join");login("chen");console.dir(document.body);function connectToServer() {var errorCode = 1;if (errorCode) {console.error("Error: %s (%i)", "Server is not responding", 500);}}connectToServer();var list = document.querySelectorAll("div.rtmarg");console.dirxml(list[0]);
6、Other Command Line API
inspect(document.body.firstChild);getEventListeners(document);var player1 = {"name": "Ted","level": 42}keys(player1);function sum(x, y) {return x + y;}monitor(sum);monitorEvents(window, "resize");
7、debugger 非常好用的一个工具
brightness = function() { debugger;var r = Math.floor(this.red*255);var g = Math.floor(this.green*255);var b = Math.floor(this.blue*255);return (r * 77 + g * 150 + b * 29) >> 8;}brightness();
调试的时候还可以加断点什么的……
8、jquery相关 firequery
$.fn.log = function() {if (window.console && console.log) {console.log(this);}return this;}$("foo.bar").find(":baz").log().hide(); 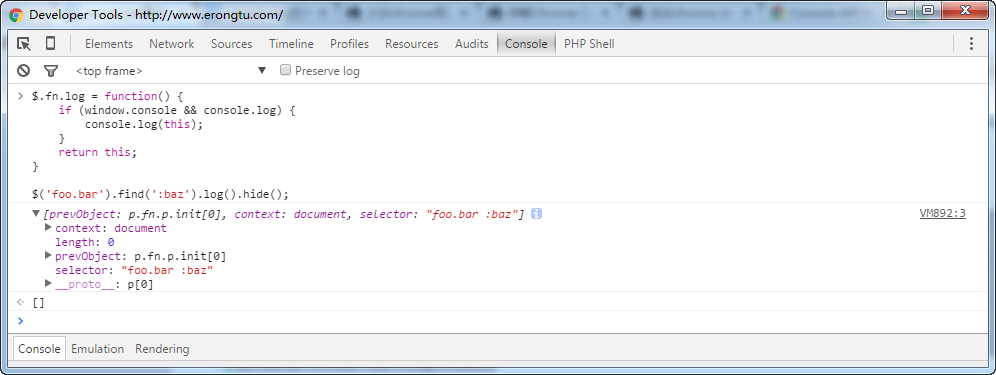
四、相关资源
Firefox
http://getfirebug.com/
(you can also now use Firefox"s built in developer tools Ctrl+Shift+J (Tools > Web Developer > Error Console), but Firebug is much better; use Firebug)
Safari and Chrome
Basically the same.
https://developer.chrome.com/devtools/index
https://developer.apple.com/technologies/safari/developer-tools.html
Internet Explorer
Don"t forget you can use compatibility modes to debug IE7 and IE8 in IE9 or IE10
http://msdn.microsoft.com/en-us/library/ie/gg589507(v=vs.85).aspx
http://msdn.microsoft.com/en-us/library/dd565628(v=vs.85).aspx
If you must access the console in IE6 for IE7 use the Firebug Lite bookmarklet
http://getfirebug.com/firebuglite/ look for stable bookmarklet
http://en.wikipedia.org/wiki/Bookmarklet
Opera
http://www.opera.com/dragonfly/
iOS
Works for all iPhones, iPod touch and iPads.
http://developer.apple.com/library/ios/ipad/#DOCUMENTATION/AppleApplications/Reference/SafariWebContent/DebuggingSafarioniPhoneContent/DebuggingSafarioniPhoneContent.html
Now with iOS 6 you can view the console through Safari in OS X if you plug in your device. Or you can do so with the emulator, simply open a Safari browser window and go to the "Develop" tab. There you will find options to get the Safari inspector to communicate with your device.
Windows Phone, Android
Both of these have no console built in and no bookmarklet ability. So we use http://jsconsole.com/type :listen and it will give you a script tag to place in your HTML. From then on you can view your console inside the jsconsole website.
iOS and Android
You can also use http://html.adobe.com/edge/inspect/ to access web inspector tools and the console on any device using their convenient browser plugin.
Older browser problems
Lastly older browsers (thanks again Microsoft) will crash if you use console.log in your code and not have the developer tools open at the same time. Luckily its an easy fix. Simple use the below code snippet at the top of your code and good old IE should leave you alone:
if(!window.console){ window.console = {log: function(){} }; }
This checks to see if the console is present, and if not it sets it to an object with a blank function calledlog. This way window.console and window.console.log is never truly undefined.
http://stackoverflow.com/questions/4539253/what-is-console-log
https://developer.chrome.com/devtools/docs/console-api#consolelogobject-object
https://developers.google.com/chrome-developer-tools/docs/console-api
http://getfirebug.com/wiki/index.php/Console_API
https://developer.chrome.com/devtools/docs/console-api
https://developer.apple.com/library/safari/documentation/AppleApplications/Conceptual/Safari_Developer_Guide/Console/Console.html
https://developer.mozilla.org/zh-CN/docs/Web/API/Console