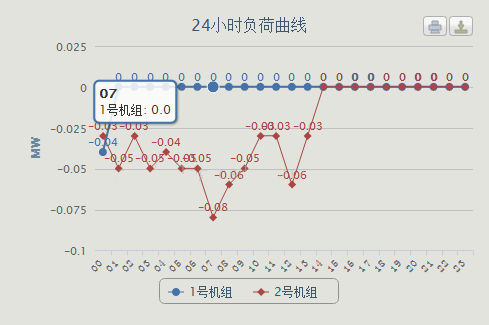
本文实例讲述了jQuery实现折线图的方法。分享给大家供大家参考。具体如下:
效果图如下所示:
js引用:
复制代码 代码如下:<script src="Js/Index/jquery-1.5.2.min.js" type="text/javascript"></script>
<script src="js/Index/raphael.2.1.0.min.js" type="text/javascript"></script>
<script src="js/Index/justgage.1.0.1.js" type="text/javascript"></script>
<script src="Js/Index/highcharts.js" type="text/javascript"></script>
<script src="Js/Index/exporting.js" type="text/javascript"></script>
定时刷新:
复制代码 代码如下://曲线图
ar chart;
$(document).ready(function() {
chart = new Highcharts.Chart({
chart: {
renderTo: "divChart", //放置图表的容器
plotBackgroundColor: null,
plotBorderWidth: null,
defaultSeriesType: "line"
},
title: {
text: "24小时负荷曲线"
},
subtitle: {
text: ""
},
xAxis: {//X轴数据
categories: ["00","01", "02","03", "04","05", "06","07", "08","09", "10","11", "12","13", "14","15", "16","17", "18","19", "20","21", "22","23"],
labels: {
rotation: -45, //字体倾斜
align: "right",
style: { font: "normal 12px 宋体" }
}
},
yAxis: {//Y轴显示文字
title: {
text: "MW"
}
},
tooltip: {
enabled: true,
formatter: function() {
return "<b>" + this.x + "</b><br/>" + this.series.name + ": " + Highcharts.numberFormat(this.y, 1);
}
},
plotOptions: {
line: {
dataLabels: {
enabled: true
},
enableMouseTracking: true//是否显示title
}
},
series: [{
name: "1号机组",
data: [0,0,0,0,0,0,0,0,0,0,0,0,0,0,0,0,0,0,0,0,0,0,0,0]
},{
name: "2号机组",
data: [0,0,0,0,0,0,0,0,0,0,0,0,0,0,0,0,0,0,0,0,0,0,0,0]
}]
});
function getForm(){
$.ajax({
type: "POST", //要用post方式
url: "WebServiceFH.asmx/GetLoadEveryHourByOne",
contentType: "application/json",
data: {},
dataType: "json",
success: function (data) {
var data = [data["Load0"],data["Load1"],data["Load2"],data["Load3"],data["Load4"],data["Load5"],data["Load6"],data["Load7"],data["Load8"],data["Load9"],data["Load10"],data["Load11"],data["Load12"],data["Load13"],data["Load14"],data["Load15"],data["Load16"],data["Load17"],data["Load18"],data["Load19"],data["Load20"],data["Load21"],data["Load22"],data["Load23"]];
chart.series[0].setData(data);
},
error: function (err) {
alert("读取数据出错!");
}
});
$.ajax({
type: "POST", //要用post方式
url: "WebServiceFH.asmx/GetLoadEveryHourByTwo",
contentType: "application/json",
dataType: "json",
success: function (data) {
var data = [data["Load0"],data["Load1"],data["Load2"],data["Load3"],data["Load4"],data["Load5"],data["Load6"],data["Load7"],data["Load8"],data["Load9"],data["Load10"],data["Load11"],data["Load12"],data["Load13"],data["Load14"],data["Load15"],data["Load16"],data["Load17"],data["Load18"],data["Load19"],data["Load20"],data["Load21"],data["Load22"],data["Load23"]];
chart.series[1].setData(data);
},
error: function (err) {
alert("读取数据出错!");
}
});
}
$(document).ready(function() {
//每隔3秒自动调用方法,实现图表的实时更新
getForm();
window.setInterval(getForm,600000);
});
});
此处注意:
复制代码 代码如下:var data = [data["Load0"],data["Load1"],data["Load2"],data["Load3"],data["Load4"],data["Load5"],data["Load6"],data["Load7"],data["Load8"],data["Load9"],data["Load10"],data["Load11"],data["Load12"],data["Load13"],data["Load14"],data["Load15"],data["Load16"],data["Load17"],data["Load18"],data["Load19"],data["Load20"],data["Load21"],data["Load22"],data["Load23"]];
chart.series[0].setData(data);
body中只需要:
复制代码 代码如下:<div id="divChart"> </div>
希望本文所述对大家的jQuery程序设计有所帮助。